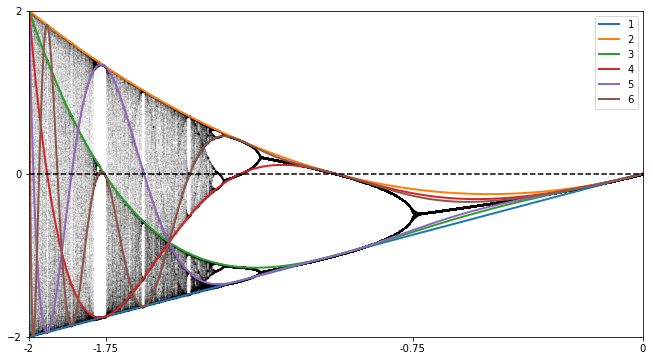
Definition 2.7.4 Critical curves
The \(n^{\text{th}}\) critical polynomial for the quadratic family is the polynomial in \(c\) defined by \(f_c^n(0)\text{.}\) The graphs of the critical polynomials are called the critical curves.
Another noticeable feature of Figure 2.6.3 is the appearance of several curves that seem to flow throughout the diagram. These are called the critical curves and we can characterize them precisely. The \(n^{\text{th}}\) critical polynomial for the quadratic family is the polynomial in \(c\) defined by \(f_c^n(0)\text{.}\) The graphs of the critical polynomials are called the critical curves.
Definition 2.7.4 Critical curves

This explains what the curves that we see in the bifurcation diagram shown in Figure 2.6.3 are but not why we see them so clearly in that unadulterated version. To understand why they emerge, we examine the image under the critical polynomials of a strip centered on the \(x\)-axis. As Figure 2.7.6 shows, such a strip maps to much thinner of curved strips on one side of the critical curves. As a result, the distribution of points in the bifurcation diagram is not uniform but tend to cluster near the curves.