Ask Your Question
0

How do I make a parametric plot?

asked 2014-06-22 18:19:49 -0600

updated 2014-06-22 18:36:17 -0600

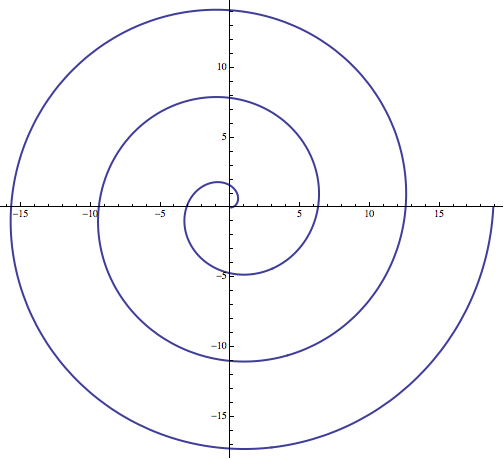
How can I generate a parametric plot with Mathematica? For example, the following function should supposedly generate a spiral: $$\vec{p}(t) = \langle t\cos(t), t\sin(t) \rangle.$$ How can I generate this spiral and show it on AskBot?

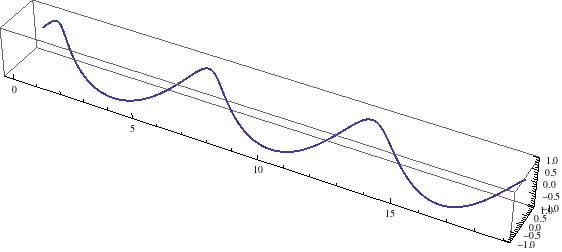
Also, what about parametric plots in 3D? For example, the following function supposedly generates a helix: $$\vec{p}(t) = \langle t, \cos(t), \sin(t) \rangle.$$

What about other tools like Desmos or WolframAlpha?

edit retag flag offensive close delete

1 Answer

Sort by ยป oldest newest most voted
0

answered 2014-06-22 18:33:47 -0600

updated 2014-06-22 18:37:00 -0600

Mathematica has a groovy command called ParametricPlot that allows you to generate parametric plots. Here's how to generate the spiral:

ParametricPlot[{t*Cos[t], t*Sin[t]}, {t, 0, 6 Pi},  PlotStyle -> Thick]

image description

There's a 3D version called ParametricPlot3D. Here's how to generate the helix:

ParametricPlot3D[{t, Cos[t], Sin[t]}, {t, 0, 6 Pi}]

image description

edit flag offensive delete publish link more
Login/Signup to Answer

Question tools

Follow
1 follower

Stats

Asked: 2014-06-22 18:19:49 -0600

Seen: 8 times

Last updated: Jun 22 '14