Revision history [back]
| | 1 | initial version | posted 2014-06-22 18:33:47 -0600 |
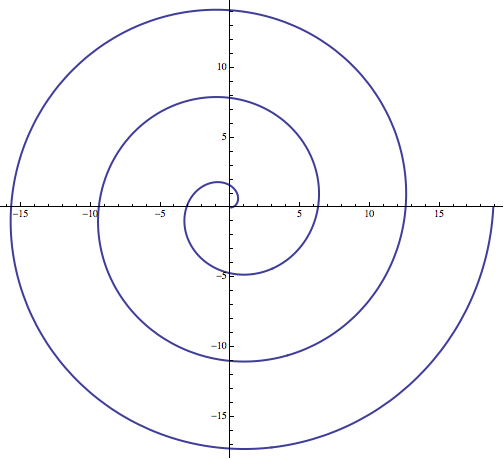
Mathematica has a groovy command called ParametricPlot that allows you to generate parametric plots. Here's how to generate the spiral:
ParametricPlot[{t*Cos[t], t*Sin[t]}, {t, 0, 6 Pi}]
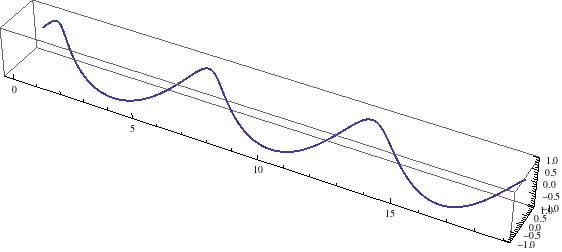
There's a 3D version called ParametricPlot3D. Here's how to generate the helix:
ParametricPlot3D[{t, Cos[t], Sin[t]}, {t, 0, 6 Pi}]
| | 2 | No.2 Revision |
Mathematica has a groovy command called ParametricPlot that allows you to generate parametric plots. Here's how to generate the spiral:
ParametricPlot[{t*Cos[t], t*Sin[t]}, {t, 0, 6 Pi}]
Pi},  PlotStyle -> Thick]
There's a 3D version called ParametricPlot3D. Here's how to generate the helix:
ParametricPlot3D[{t, Cos[t], Sin[t]}, {t, 0, 6 Pi}]
