
First order sketches

Let's suppose that $u$ satisfies the first order IVP
$$u_t + 2u_x = 0, \: u(x,0) = u_0(x),$$
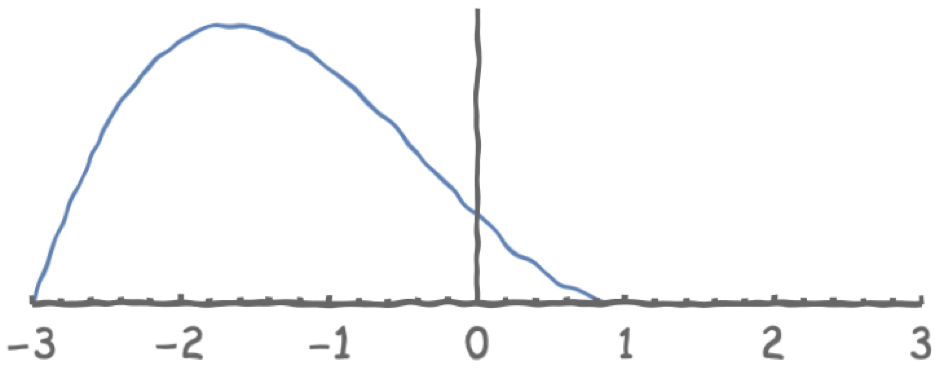
where $u_0$ is a function whose graph looks something like this:
Sketch the graphs of $u(x,t)$ for $t=1,2,3$.
-----
Suppose we change the PDE to $u_t + 2u_x = -u$. How will this change the graphs?
Comments
The solution to the PDE is
$$u = u_0(x - 2t),$$
so at each time interval, the graph above will shift to the right by two units. Here are sketches of the graph at each of the three times:
If we changed the PDE to $u_t + 2u_x = -u$, the solution becomes
$$u = u_0(x - 2t)e^{-t},$$
so $u$ will decay over time, approaching zero at large values of $t$.