Saved /Users/mcmcclur/GitHubDocuments/MarksMath/writ/MapProjection/newFigures/Figure1.png
Saved /Users/mcmcclur/GitHubDocuments/MarksMath/writ/MapProjection/newFigures/Figure1.pdfMap projection figures
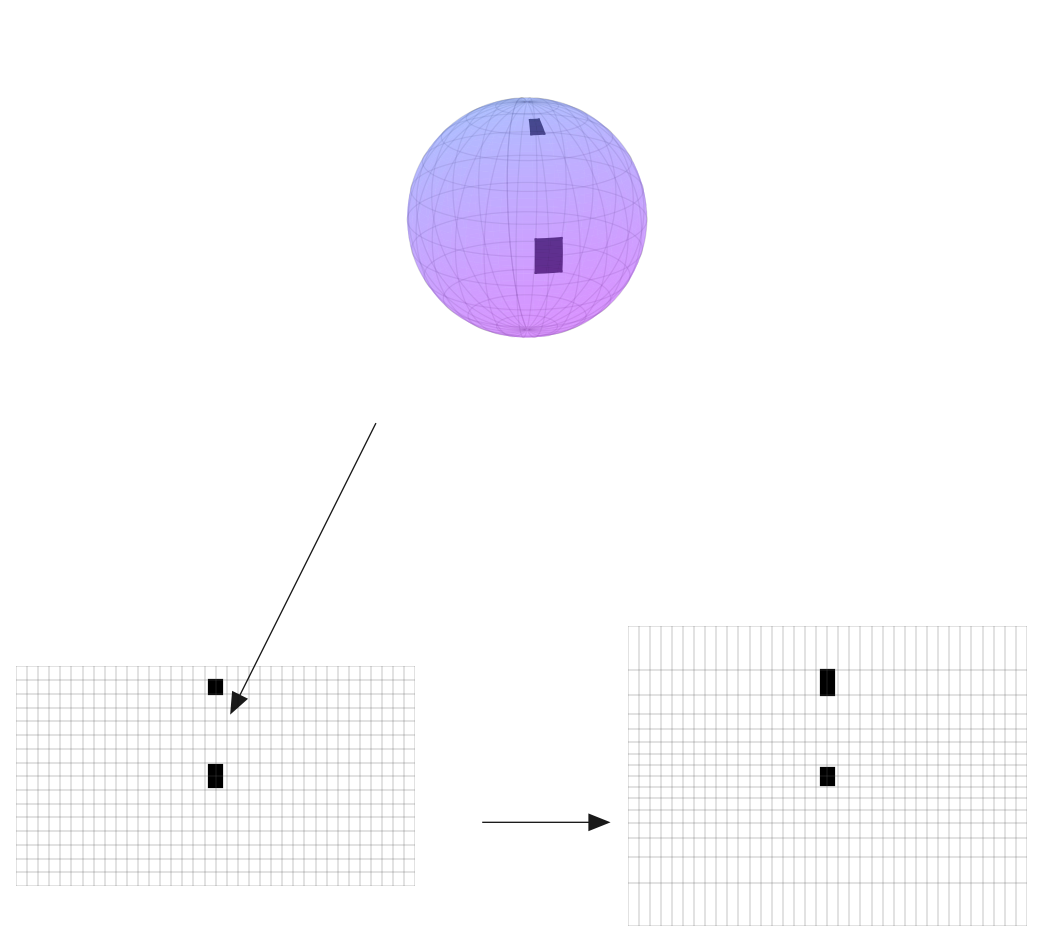
This notebook regenerates figures for the map-projection writeup. The first cell below redraws Figure1 using only Python, matplotlib, and the local triangulated-land.json data.
Figure 4
This figure uses two rhumb lines intersecting at a chosen point on the sphere. In the Mercator panel those rhumb lines become straight lines and preserve their angle, while the equirectangular panel distorts that angle.
Figure 5
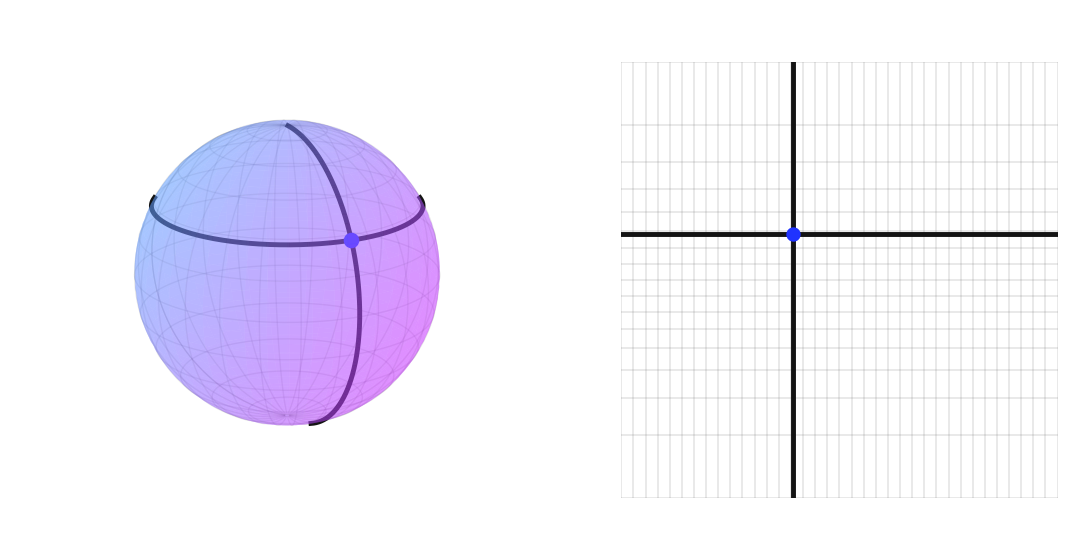
Figure 9