Linear Models and Regression
Sometimes, two numerical variables have a noticeable relationship. Regression is a tool to help find and test the strength that relationship. In the simplest case, the relationship might be linear so we apply regression to a linear model.
This material is detailed in Chapter 8 of our text.
Linear Models
One of the simplest types of relationships between two variables is a linear relationship - say, $$Y = aX+b.$$ In statistics, $X$ and $Y$ are typically random variables so we might ask questions like:
- Is there really a linear relationship between $X$ and $Y$?
- If so, what are the values of the parameters $a$ and $b$?
- What kind of predictions can we make using this relationship?
- How confident can be in those predictions?
Possom Example from the text
Here's the plot of an example right from our text that relates the head length to total length for 104 possums.

The regression line
Here's the so-called "regression line" that models the data. We might infer from this line that a possum with a head length of 101 mm would have a total lenght of about 94 cm.

CFB Example
Correlating wins and losses to stats in College Football
Lines in the plane
A line is the graph of an equation of the form $y=ax+b$.
The defining characteristic of such a graph is that it's slope is constant, i.e. if $y_1=ax_1+b$ and $y_2 = ax_2+b$, then
$$\frac{\Delta y}{\Delta x} = \frac{y_2-y_1}{x_2-x_1} = \frac{(ax_2+b)-(ax_1+b)}{x_2-x_1} = \frac{a(x_2-x_1)}{x_2-x_1} = a.$$While that might seem complicated, it ultimately makes it easy to plot the line.
Plotting a line
We can plot a line simply by plugging in a couple of points.
For example, to graph $y=2x+1$, plug in $x=0$ to get $y=0$ - that's one point!
Then plug in $x=1$ to get $y=3$ - that's another point!
Draw the line through both of those.
An interactive plot
Here's a fun tool to see how the coefficients $a$ and $b$ affect the graph of $y=ax+b$.
Using a regression line
In statistics, the forumula for a line will often be generated via software; you just need to interpret it. Thus it will be important for you to be able to plug a value like $x=1.234$ in to a line like $y=-5.8335x+0.8408$ to get a value. In this case: $$-5.8335\times1.234+0.8408 = −6.357739.$$
Possums revisited
The possum example comes right from section 8.1 of our text. I took the data and analyzed with Desmos to get the following:
The Desmos analysis
On the actual Desmos page we see something that looks like the following:
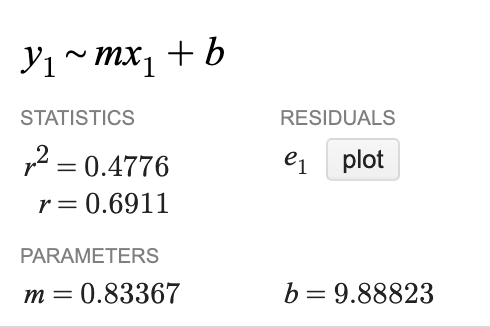
Of particular importance is the correlation $r=0.6911$ and the coefficients $m$ and $b$, which tell us that $$y = 0.8336697990278819x + 9.888233331751707$$
Another look at the picture

Correlation
The symbol $r$ in the Desmos output stands for correlation, which measures the strength of the linear relationship. The correlation is always between −1 and +1 and
- A number close to +1 indicates a strong, positive linear relationship,
- A number close to −1 indicates a strong, negative linear relationship,
- A number close 0 indicates a weak linear relationship.
Examples
A p-value
Check out this little snippet from our Data Explorer:
Note specifically, the pvalue. A very small value tells us that there is a relationship between the two variables.