Final Practice Solutions
for Stat 185
Here are the solutions to the practice problems for next week's final exam.
Problem 1
Suppose we randomly select 105 competitors in the 2012 Boston Marathon found an average time of 253.77 minutes with a standard deviation of 45.72 minutes. We wish to write down a $98\%$ confidence interval for this data.
- Find the standard error associated with this sample.
- Use a normal table to find the $z^*$ value that corresponds to a $98\%$ confidence interval.
- Write down the $98\%$ confidence interval.
Solution
As we know, the confidence interval should have the form $$\bar{x} \pm z^* SE,$$ where $\bar{x}=253.77$ is the computed mean and the standard error is the computed standard deviation divided by the sample size: $$SE = s/\sqrt{n} = 45.72/\sqrt{105} \approx 4.46$$ That last part is the solution to part (a).
Solution (cont)
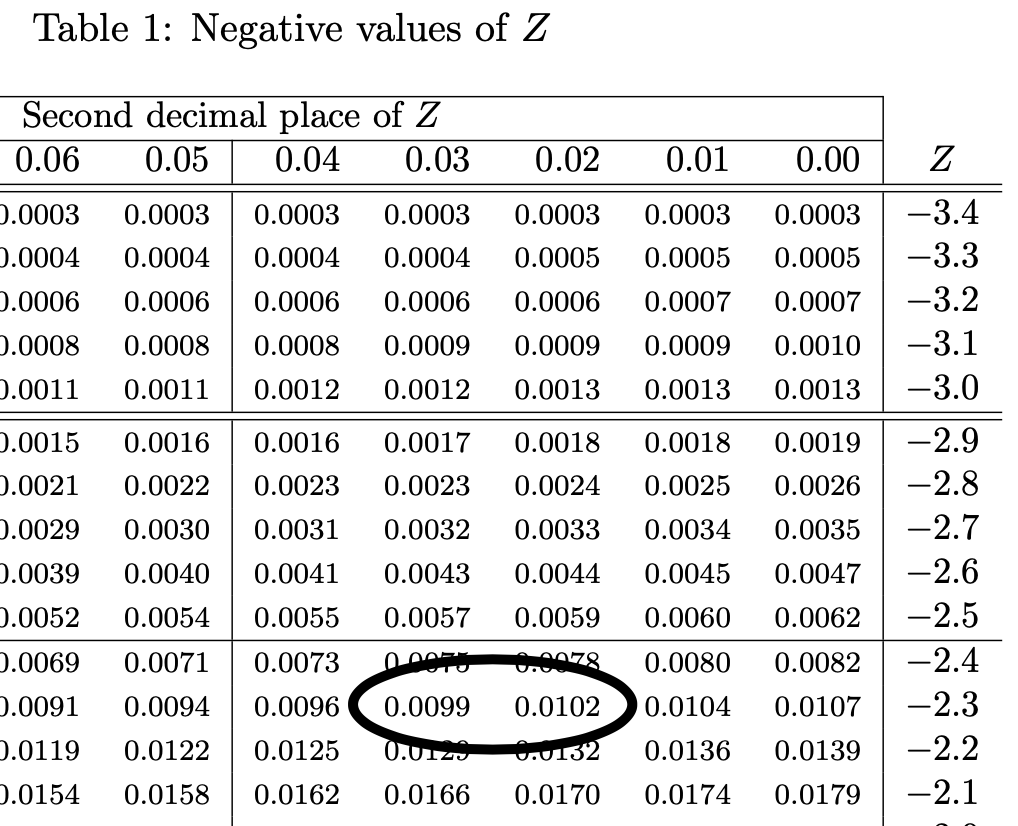
To find $z^*$ for a $98\%$ confindence level, look for $(1-0.98)/2 = 0.01$ in the normal table. It looks like, we get a value between $2.32$ and $2.33$. (Either of those is fine, though I prefer to round up.)
Solution wrap-up
For the final answer, we get
$$\bar{x} \pm z^* SE = 253.77 \pm 2.33 \times 4.46.$$Problem 2
Suppose we randomly select 4 runners from the 2012 Boston marathon and find their times in minutes to be
| 273.8 | 203.5 | 259.4 | 246.1 |
- Write down a formula showing that the mean of these times is $245.7$.
- Write down a formula showing that the standard deviation of these times is approximately $30.3$.
- Find the standard error associated with this sample.
- Write down a $95\%$ confidence interval for the average time of Boston Marathon runner based on this data.
Solution for part (a)
The mean is $$\bar{x} = \frac{x_1 + x_2 + \cdots + x_n}{n} = \frac{273.8 + 203.5 + 259.4 +246.1}{4} = 245.7.$$
Solution for part (b)
The standard deviation is $$\begin{aligned} s &= \sqrt{\frac{(x_1 - \bar{x})^2 + (x_2 - \bar{x})^2 + \cdots + (x_n - \bar{x})^2}{n-1}} \\ &= \sqrt{\frac{(273.8 - 245.7)^2 + (203.5 - 245.7)^2 + (259.5 - 245.7)^2 + (246.1 - 245.7)^2}{3}} \\ &\approx 30.3373. \end{aligned}$$
Solution for part (c)
The standard error is $$SE = \frac{s}{\sqrt{n}} = \frac{30.3373}{\sqrt{4}} = 15.16.$$
Solution to part (d)
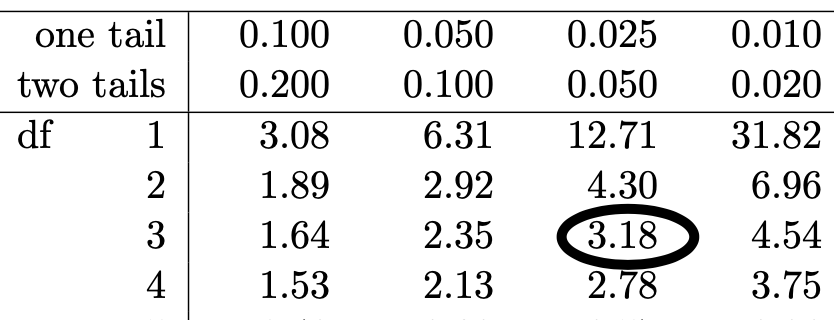
To write down the confidence interval, we'll need a $t^*$ multiplier, which we look up in our $t$-table. We find that for a a two-tailed significance of level of $0.05$, we'll need $t^*=3.18$:
Solution to part (d) wrap-up
Finally, our confidence interval is $$\bar{x} \pm t^* \times SE = 245.7 \pm 3.18 \times 15.15.$$
Problem 3
A random sample of 1200 runners in the 2012 Boston Marathon found that 507 of them were women. Run a hypothesis test to check the null hypothesis that half of marathon runners are women against the alternative hypothesis that less than half of marathon runners are women. Be sure to
- Clearly state your hypothesis in terms of differences,
- compute the standard error,
- compute the test-statistic, and
- state the conclusion.
Solution to part (a)
The hypothesis test is $$\begin{aligned} & H_0: p = 0.5 \\ & H_A: p < 0.5, \end{aligned}$$ where $p$ denotes the proportion of marathon runners who are women.
Solution to part (b)
The standard error is $$SE = \sqrt{\frac{p(1-p)}{n}} = \sqrt{\frac{0.5\times0.5}{1200}} \approx 0.0144.$$
Solution to part (c)
The test-statistic is $$T = \frac{\hat{p} - p}{SE} = \frac{\frac{507}{1200} - 0.5}{0.0144} \approx -5.38$$
To conclude the test, we'll clearly reject the null hypothesis with such an extreme test statistic.
Problem 4
In the 2012 Boston Marathon, there were
- 7217 runners in their 40s with an average time of 255.2 minutes and a standard deviation of 43.7 minutes, and
- 4156 runners in their 50s with an average time of 270.8 minutes and a standard deviation of 44.7 minutes.
Use this information to test the null hypotesis that $\mu_{40}=\mu_{50}$ against the alternative hypthesis that $\mu_{40} < \mu_{50}$, where $\mu_{40}$ denotes the average time of runners in their forties and $\mu_{50}$ denotes the average time of runners in their fifties. Be sure to
- Clearly state your hypothesis in terms of differences,
- compute the standard error,
- compute the test-statistic, and
- state the conclusion.
Solution to part (a)
The hypothesis test is $$\begin{aligned} & H_0: \mu_{40} - \mu_{50} = 0 \\ & H_A: \mu_{40} - \mu_{50} < 0 \\ \end{aligned}$$ where $\mu_{40}$ denotes the average time of marathon runners in their 40s and $\mu_{50} denotes the average time of marathon runners in their 50s.
Solution for part (b)
The standard error is $$SE = \sqrt{\frac{s_{40}^2}{n_{40}} + \frac{s_{50}^2}{n_{50}}} = \sqrt{\frac{43.7^2}{7217} + \frac{44.7^2}{4156}} = 0.863.$$
Solution for part (c)
The test-statistic is $$\frac{\mu_{40}-\mu_{50}}{SE} = \frac{255.2-270.8}{0.863} = -18.0765.$$ We, again, immediately reject the null hypothesis.
Problem 5
In the 2012 Boston Marathon, there were 59 runners under the age of 40 who had also run the Boston Marathon in 2002 when they were under the age of 30. I computed the pairwise difference of those runners' times in 2012 minus their times in 2002 and found a mean of 26.1 minutes with a standard deviation of 32.7 minutes. Let's use this data to run a hypothesis test to see if runners slow down over this age range. Specifically, let $\mu_1$ denote their first time in 2002 and let $\mu_2$ denote their second time in 2012. Test the null hypothesis that $\mu_1 = \mu_2$ vs the alternative hypothesis that $\mu_1<\mu_2$ at the $99\%$ confidence level. Be sure to
- Clearly state your hypothesis in terms of differences,
- compute the standard error,
- compute the test-statistic, and
- state the conclusion.
Solution to part (a)
The hypothesis test is $$\begin{aligned} & H_0: \mu_{1} - \mu_{2} = 0 \\ & H_A: \mu_{1} - \mu_{2} < 0. \\ \end{aligned}$$
Solution for part (b)
The standard error is $$SE = s/\sqrt{n} = 32.7/\sqrt{59} = 4.257.$$
Solution for part (c)
The test statistic is $$\frac{\bar{x}-0}{SE} = \frac{26.1}{4.257} = 6.13.$$ Once again, we immediately reject the null.
Problem 6
The picture below shows a scatter plot for a random sample of 1200 runners in the Boston Marathon. The $x$-coordinate of each point corresponds to the runner's age and the $y$-coordinate corresponds to the runners time in minutes. The regression line for the data is also shown and has formula $y = 0.719x + 227.6.$

Problem 6 (statement continued)
- What time does this regression model predict for a 56 year old runner?
- Which of the following could be a reasonable value for the correlation between age and time: 0.9, 0.2, -0.2, or -0.9?
-
Suppose I run a linear regression test on this data and I get results like the following:
LinregressResult(slope=0.71868458889427973,
  intercept=227.5951853339659, rvalue=0.258752071669993,
  pvalue=8.263097704087485e-20, stderr=0.13124270715070266)
Can I conclude at the 99% level of conficence that there is a linear relationship between age and speed?
Solution for part (a)
Simply plug the number $x=56$ into the regression formula to get a prediction of $$0.719\times56 + 227.6 = 267.864.$$
Solution for part (b)
The positive slope of the regression line indicates a positive relationship between the variables, which rules out the negative numbers. Given how scattered about the points are, I'd have to go with $0.2$ over $0.9$.
Solution for part (c)
The outrageously small $p$-value of
pvalue=8.263097704087485e-20indicates that we certainly reject the null hypothesis of no relationship, in favor of the alternative hypothesis that there is a relationship between the variables.