The phase line and bifurcations
We return to our focus on the qualitative analysis of first order, autonomous equations today, where the concept of a slope field can be condensed and simplified a bit to that of the phase line. In turn, this simplification can be study the important concept of bifurcation.
The phase line
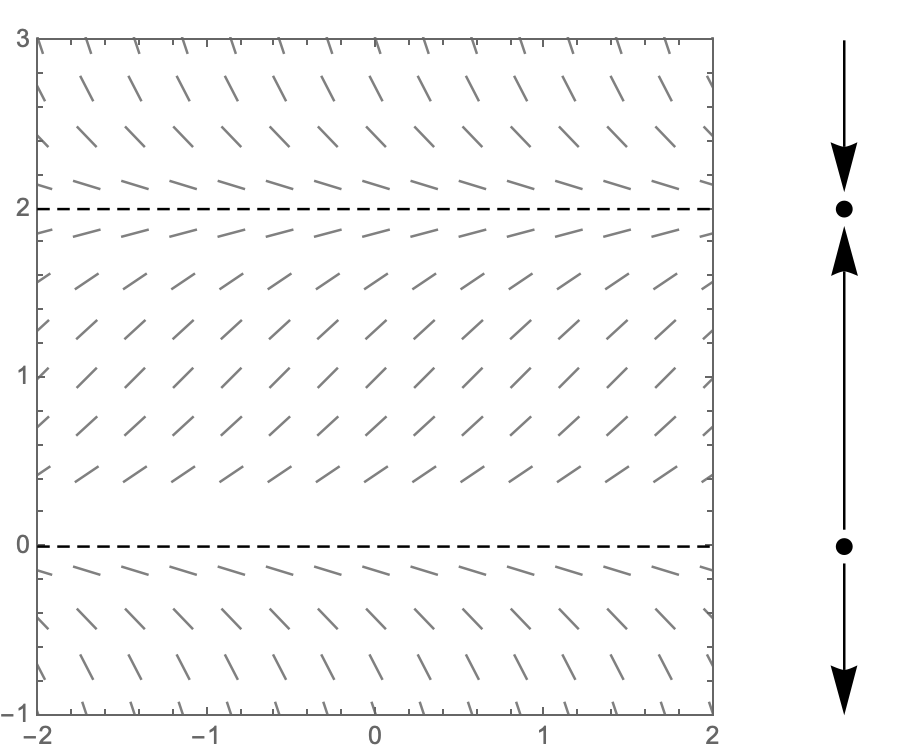
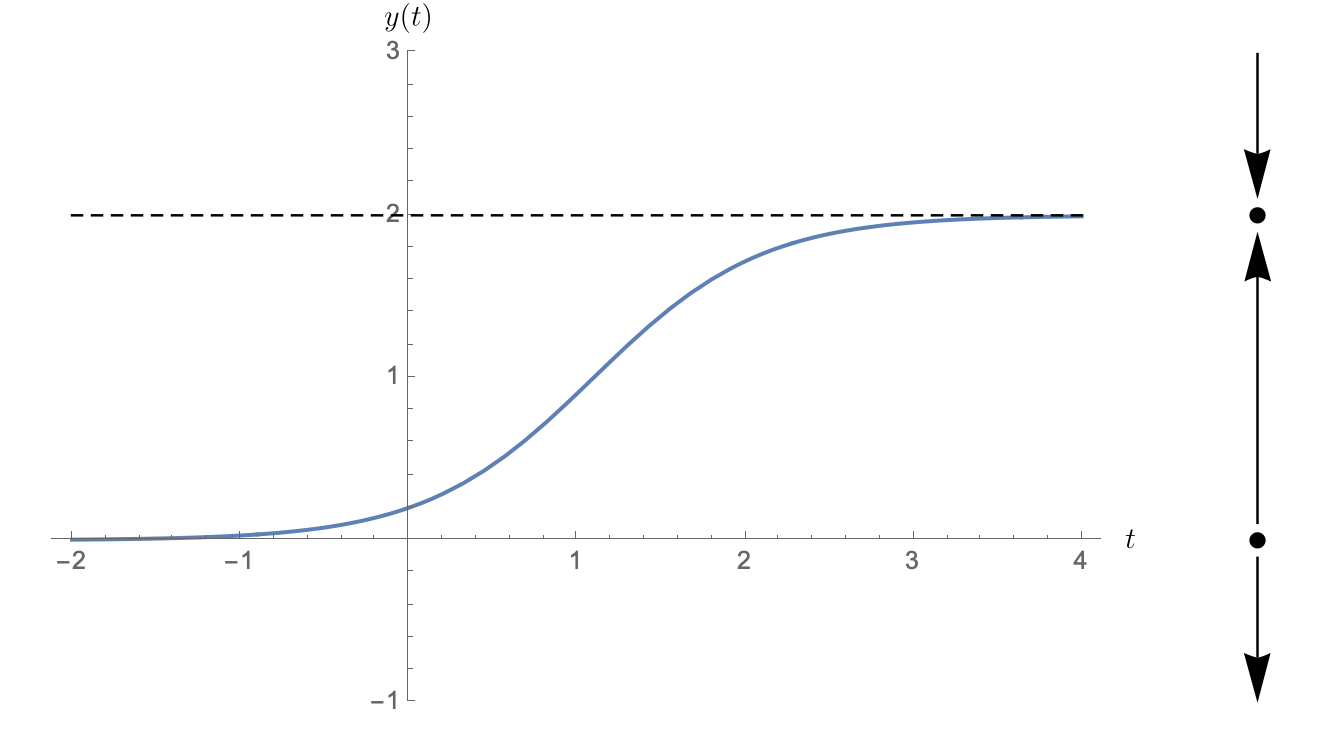
The picture below shows the slope field for the logistic equation $y'=y(2-y)$. Since this equation is autonomous, the slope remains constant along any horizontal line. This allows us to compress the picture horizontally to obtain much of the same information in a one-dimensional picture called the phase line, which is shown to the right.
Drawing the phase line (horizontally)
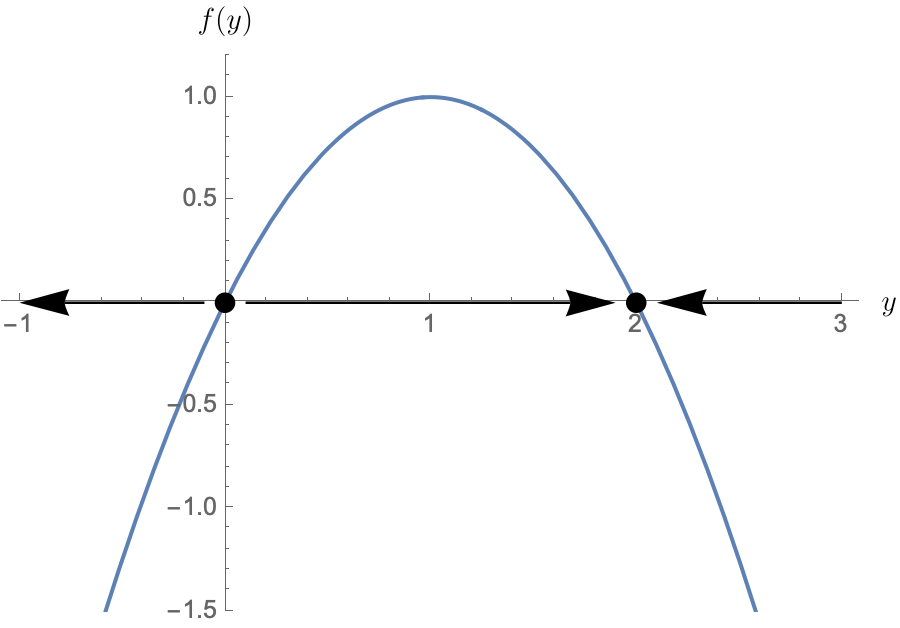
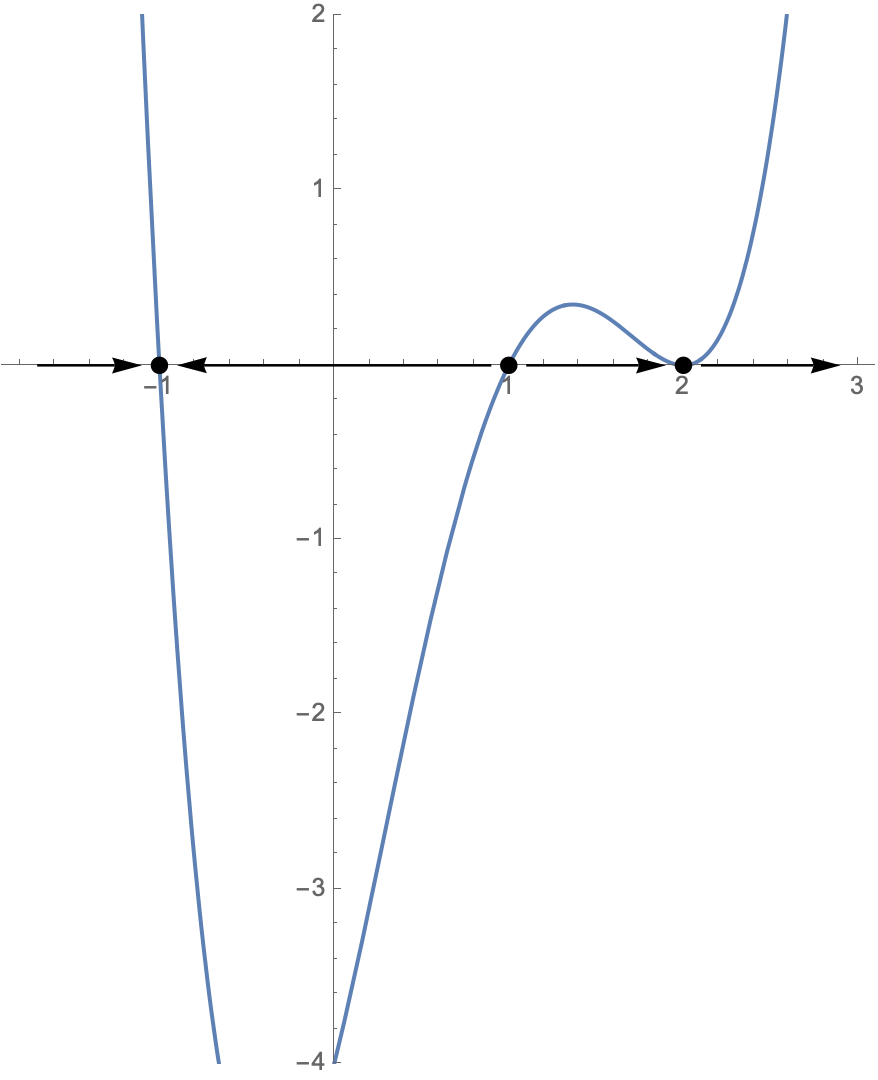
You can draw a phase line by simply drawing the graph of the function, then drawing arrows between the roots with
- The arrow pointing right where $f>0$ and
- the arrow pointing left where $f<0$.
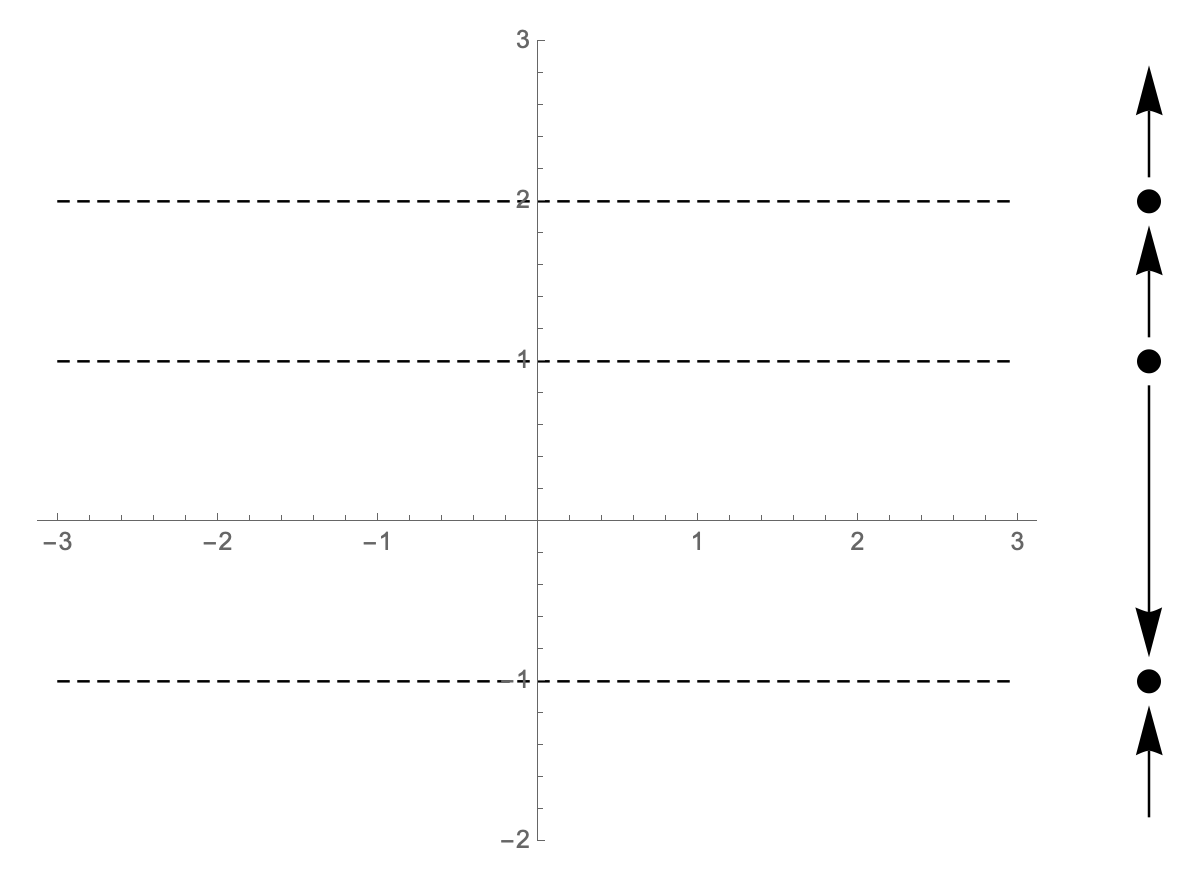
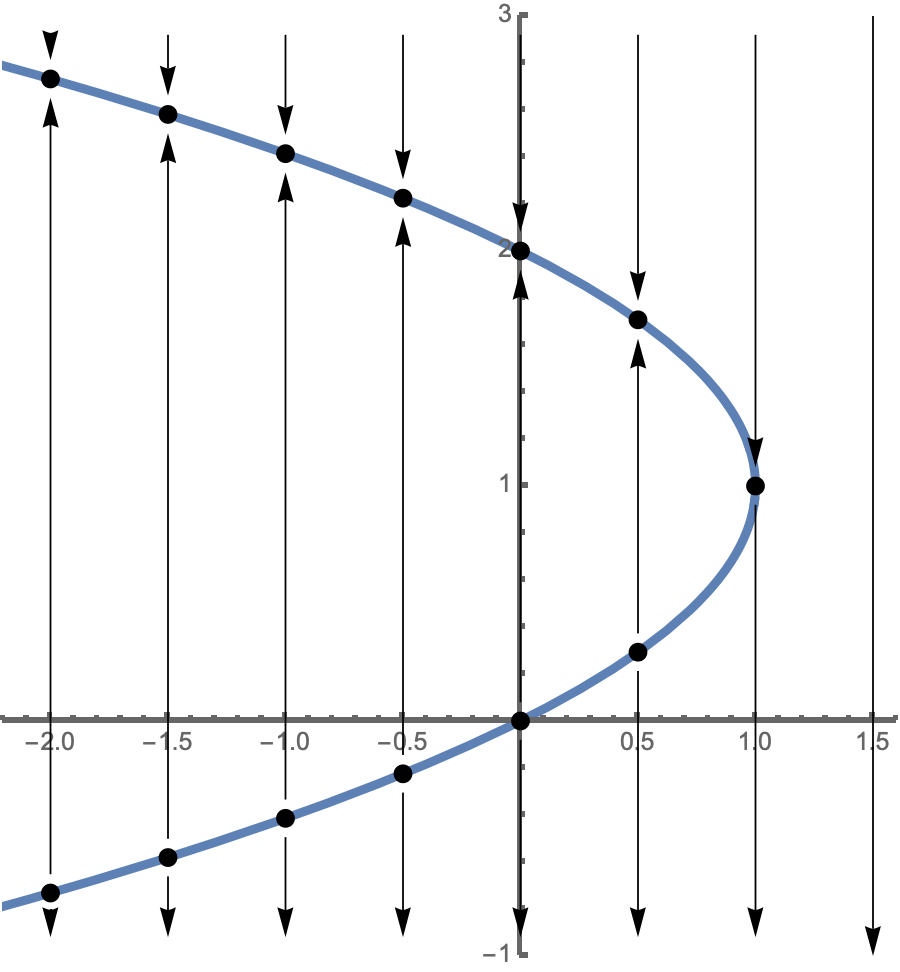
Drawing the phase line (vertically)
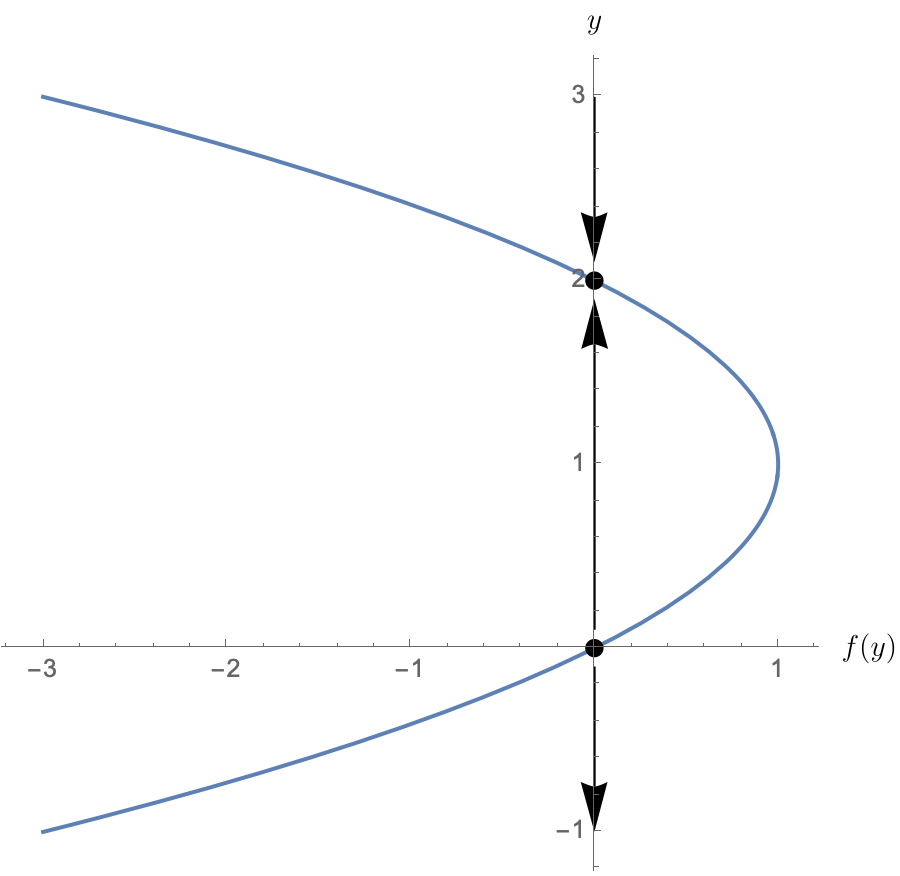
Of course, we might choose to swap the axes since we ultimately want to draw $y$ as a function of $t$.
Drawing the solution
Note that the phase line simply indicates the equilibria as dots and indicates whether solutions are increasing or decreasing between those dots. While you do lose some information on the rate of change, you still get enough qualitative information to sketch a solution $y$ as a function of $t$.
A not so complicated solution
I bet you could still turn that phase line vertical, mark the equilibria and draw some solutions.
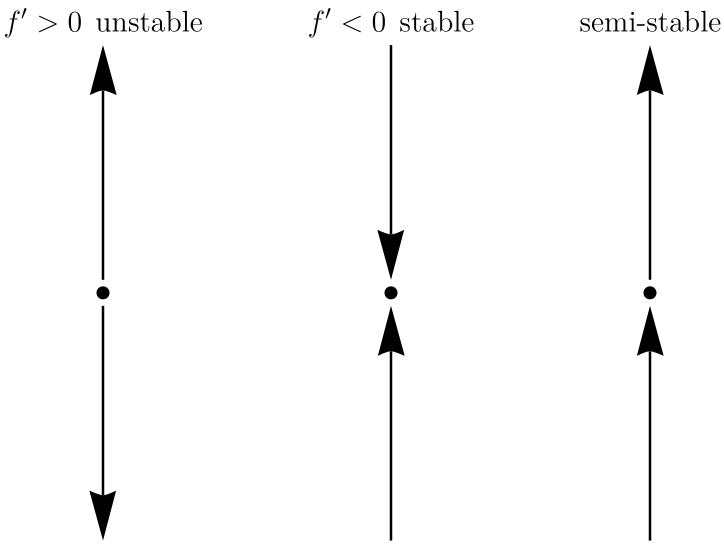
Stability
The phase line immediately clarifies the idea of stabiity. It's also pretty easy to see how the valur of the derivative $f'(y)$ at the equilibrium $y_0$ affects the stability. Note that, when $f'(y_0)=0$, there are a variety of possibilities - just one of which is shown.
Bifurcation
Many ODEs depend upon one or more parameters. Sometimes, the values of those parameters themselves can change and it can be very important to understand how those changes affect the nature of the solutions.
When a small change in a parameter causes an abrupt change in the qualitative or quantitative behavior of solutions, we say that a bifurcation has occurred.
Example
A logistic equation with harvesting can be written
$$P' = rP(1-P/K)-h.$$We've met the growth rate $r$ and carrying capacity $K$ before. The parameter $h$ is new and might represent a certain amount removed periodically. This is called harvesting.
Let's examine how changes in the rate of harvesting might affect the nature of solutions.
A dynamical exploration
In the interactive graphic below, you change change the harvesting rate with the slider. Watch what happens if you harvest too much!
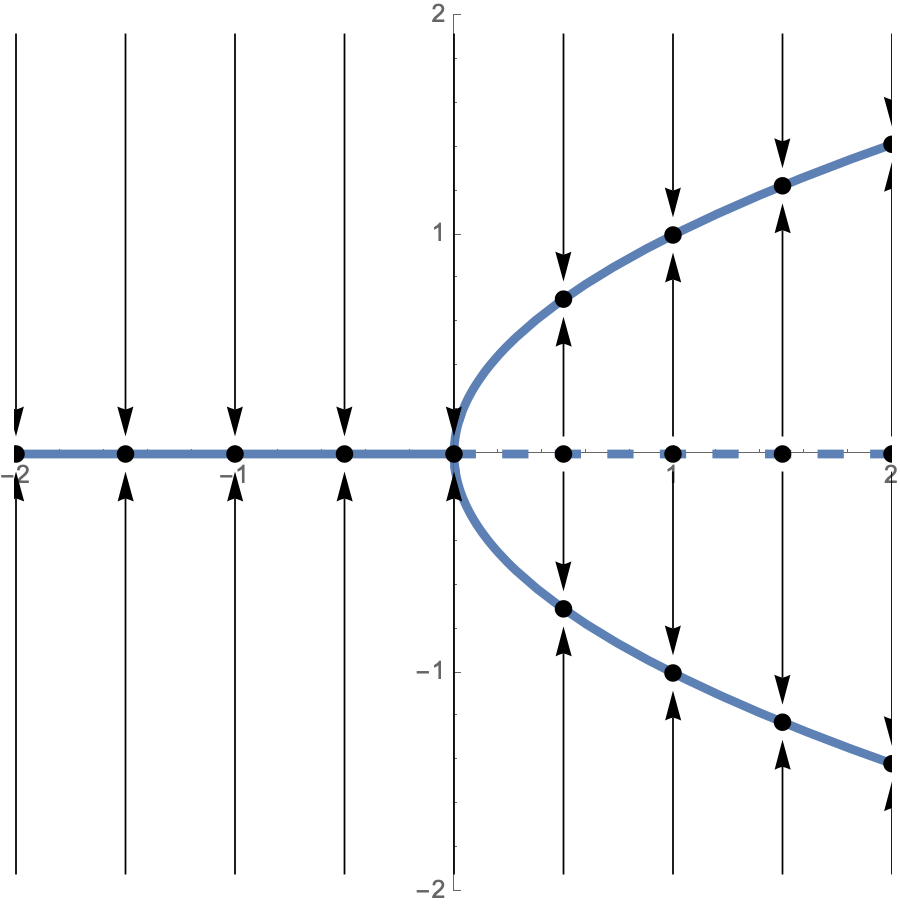
A bifurcation diagram
On paper, time is often associated with the horizontal axis and we draw several vertical phase lines next to one another to obtain the bifurcation diagram. The equilibria typically lie on differentiable curves and we can see how the phase lines point to regions of stability or away from regions of instability along those curves.
The pitchfork bifurcation
This interactive explores the family $y'=ry-y^3$. There's always an equilibrium at zero, but its nature changes as the parameter $r$ passes through zero.
The pitchfork bifurcation diagram
You can see where the name comes from by examining the bifurcation diagram.