Means, Proportions, Hypotheses, and Confidence Intervals
Confidence intervals
A confidence interval for a mean of numerical data has the form
$$\left[\overline{x}-t^*\times\frac{\sigma}{\sqrt{n}},\, \overline{x}+t^*\times\frac{\sigma}{\sqrt{n}}\right],$$
where $\overline{x}$ and $\sigma$ are measured from the sample and $n$ is the sample size.
A confidence interval for a proportion of categorical data has the form
$$\left[\hat{p}-t^*\times\sqrt{\frac{\hat{p}(1-\hat{p})}{n}},\, \hat{p}+t^*\times\sqrt{\frac{\hat{p}(1-\hat{p})}{n}}\right]$$
where $\hat{p}$ is measured from the sample and $n$ is the sample size. Note that, for a proportion, we have
$$\sigma = \hat{p}(1-\hat{p}),$$
Thus, this formula is practically the same as above.
In both cases, you can safely replace the $t^*$ multiplier with a $z^*$ multiplier from the normal distribution, when $n$ is large.
Hypothesis testing
A hypothesis statement for a mean looks like
- $H_0: \mu=\mu_0$
- $H_A: \mu\neq\mu_0$ or $H_A: \mu<\mu_0$ or $H_A: \mu>\mu_0$
Given data with measured mean $\overline{x}$ and standard deviation $\sigma$, the test statistic is
$$T = \frac{\overline{x}-\mu_0}{\sigma/\sqrt{n}}.$$
A hypothesis statement for a proportion looks like
- $H_0: p=p_0$
- $H_A: \mu\neq p_0$ or $H_A: p<p_0$ or $H_A: p>p_0$
Given data with measured proportion $\hat{p}$, the test statistic is
$$T = \frac{\hat{p}-p_0}{\sqrt{p_0(1-p_0)/n}}.$$
Note that the choice of mean $p_0$ and standard deviation $\sqrt{p_0(1-p_0)/n}$ for the distribution that we'll use are driven by the assumption that the null hypothesis is correct.
In both cases, we compute the $p$-value by comparing the test statistic against the standard normal or $t$-distribution with the appropriate degrees of freedom. Your computation should be guided by an image that looks something like so:
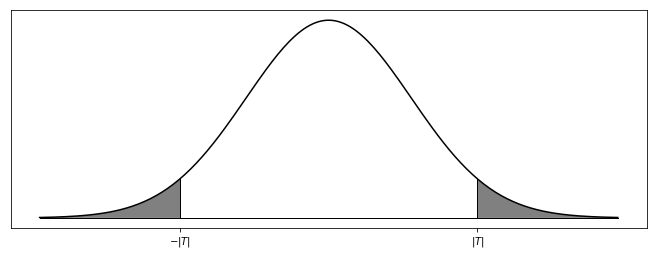
You might be intereted in one side or the other or both depending on your hypothesis statement.
An example hypothesis test for a proportion
Let's return to our data on body temperature from last time:
import pandas as pd
df = pd.read_csv('https://www.marksmath.org/data/normtemp.csv')
df.head()
We now ask the question: Is the proportion of people who's body temperature is less than $98.6^{\circ}$ less than $1/2$? Let's ue a 99% confidence level.
Written as a hypothesis test:
- $H_0: p=1/2$
- $H_A: p<1/2$
with $\alpha=0.01$.
p = df[df.body_temperature<98.6].shape[0]/df.shape[0]
p
Here's the test statistic:
import numpy as np
T = (p-0.5)/np.sqrt(0.5*(1-0.5)/130)
T
Finally, here's the $p$-value:
from scipy.stats import norm
1-norm.cdf(2.8)
Since this is less than 0.01, we reject the null hypothesis.