The \(x^x\) Spindle
Check out this graph of \(x^x\) produced by Desmos:
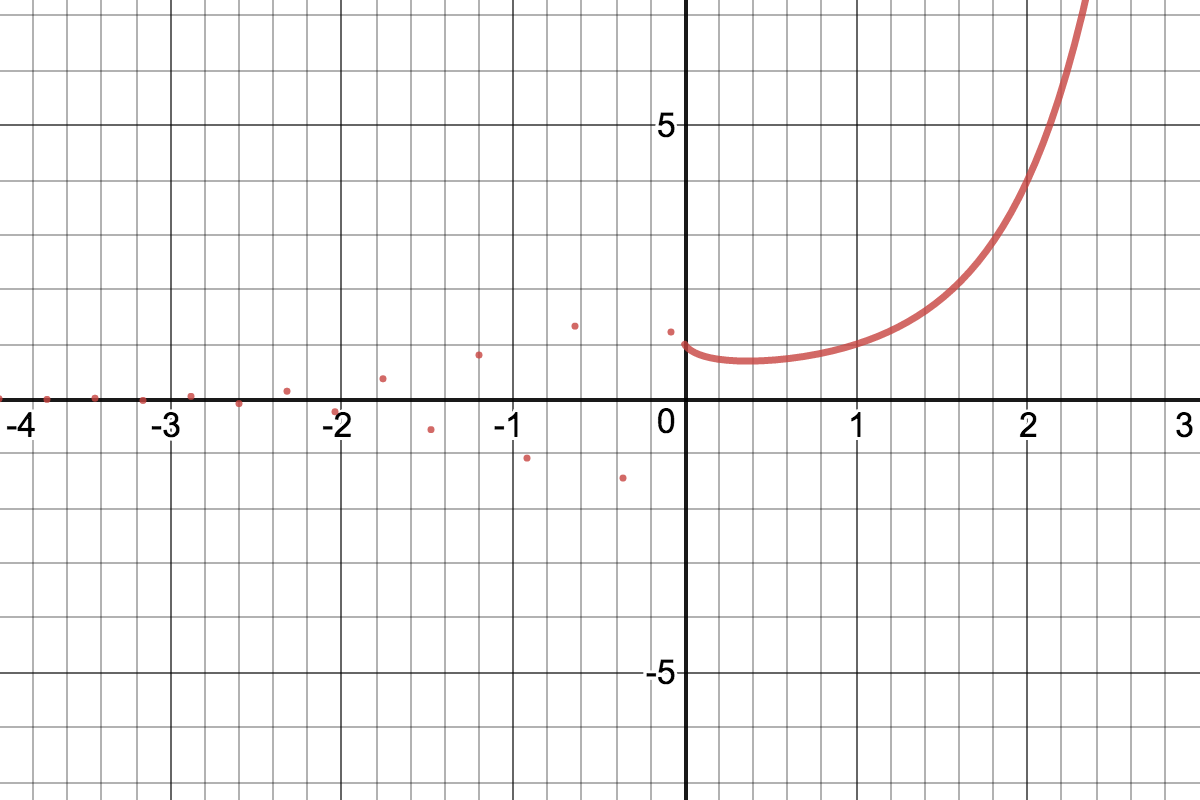
It's even crazier, if you look at the live version. What's going on with those dots to the left of the \(y\)-axis?
Well, \(f\) is defined at some points but not at others. For example, \((-1/2)^{-1/2}\) makes no sense as a real number but \[ \begin{align} (-1/3)^{-1/3} &= -\sqrt[3]{3} \approx -1.44225 \: \text{ and }\\ (-8/5)^{-8/5} &= \sqrt[5]{(-5/8)^8} \approx 0.47142. \end{align} \] Note that it's sometimes positive and sometimes negative but often not defined as a real number at all giving rise to the collection of dots in the graph.
If we allow complex values, though, we can define \(x^x\) for all real \(x\). For example, \[(-1/2)^{-1/2} = \sqrt{-2} = \sqrt{2}i.\] We can even plot this point on a complex plane that's perpendicular to the real \(x\)-axis. If we do this for a bunch of points, we generate a groovy thread that wraps around the negative real axis.
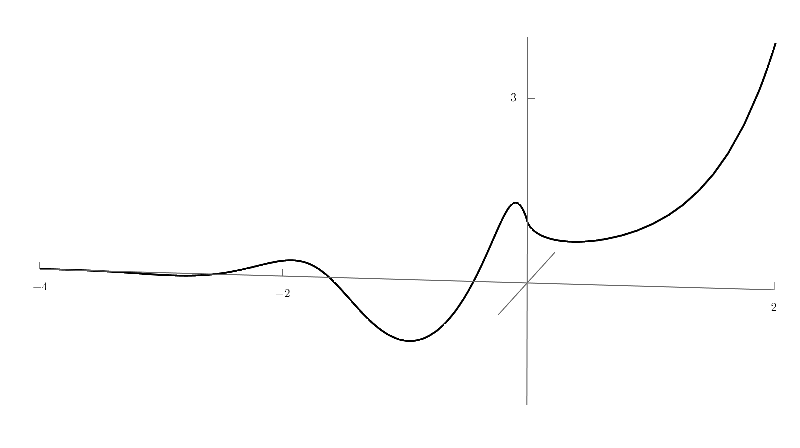
I guess the definition that we're using here is \[ x^x = e^{x \, \text{Log}(x)}, \] where we're using the principal logarithm. As it turns out, though, we can use other branches of the logarithm to generate other brances of \(x^x\). If we plot a bunch of these, we get the following: