Population density visualizations with Datawrapper
The beautiful visualizations below were built with Datawrapper, which provides an easy to use, point and click interface to build visualizations.
Datawrapper is so easy to use, in part, because it focuses on chart types. Observable Plot, by contrast, focuses on geometric marks. While this requires a bit more work, it also provides much greater flexibility.
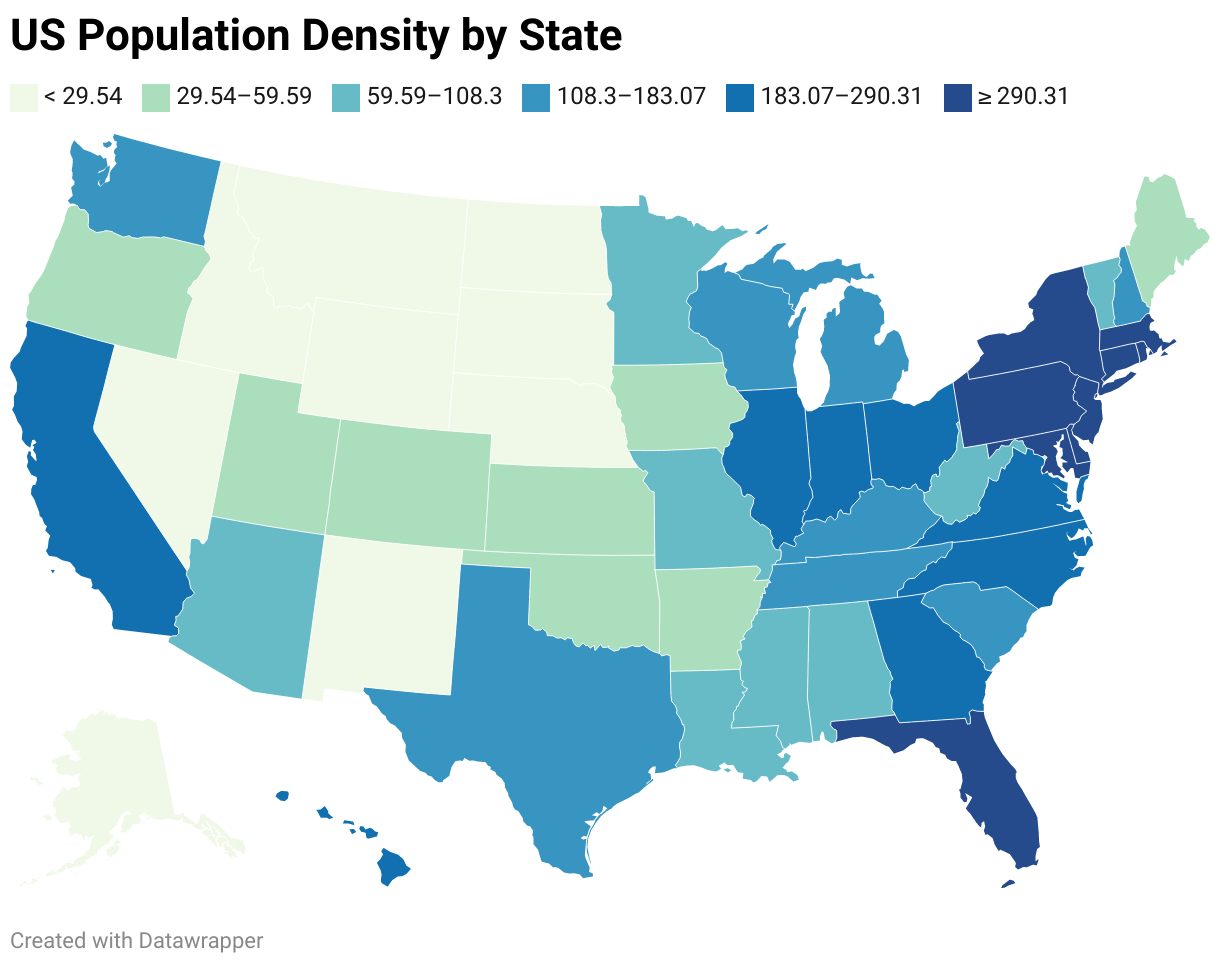
A hovervable choropleth map
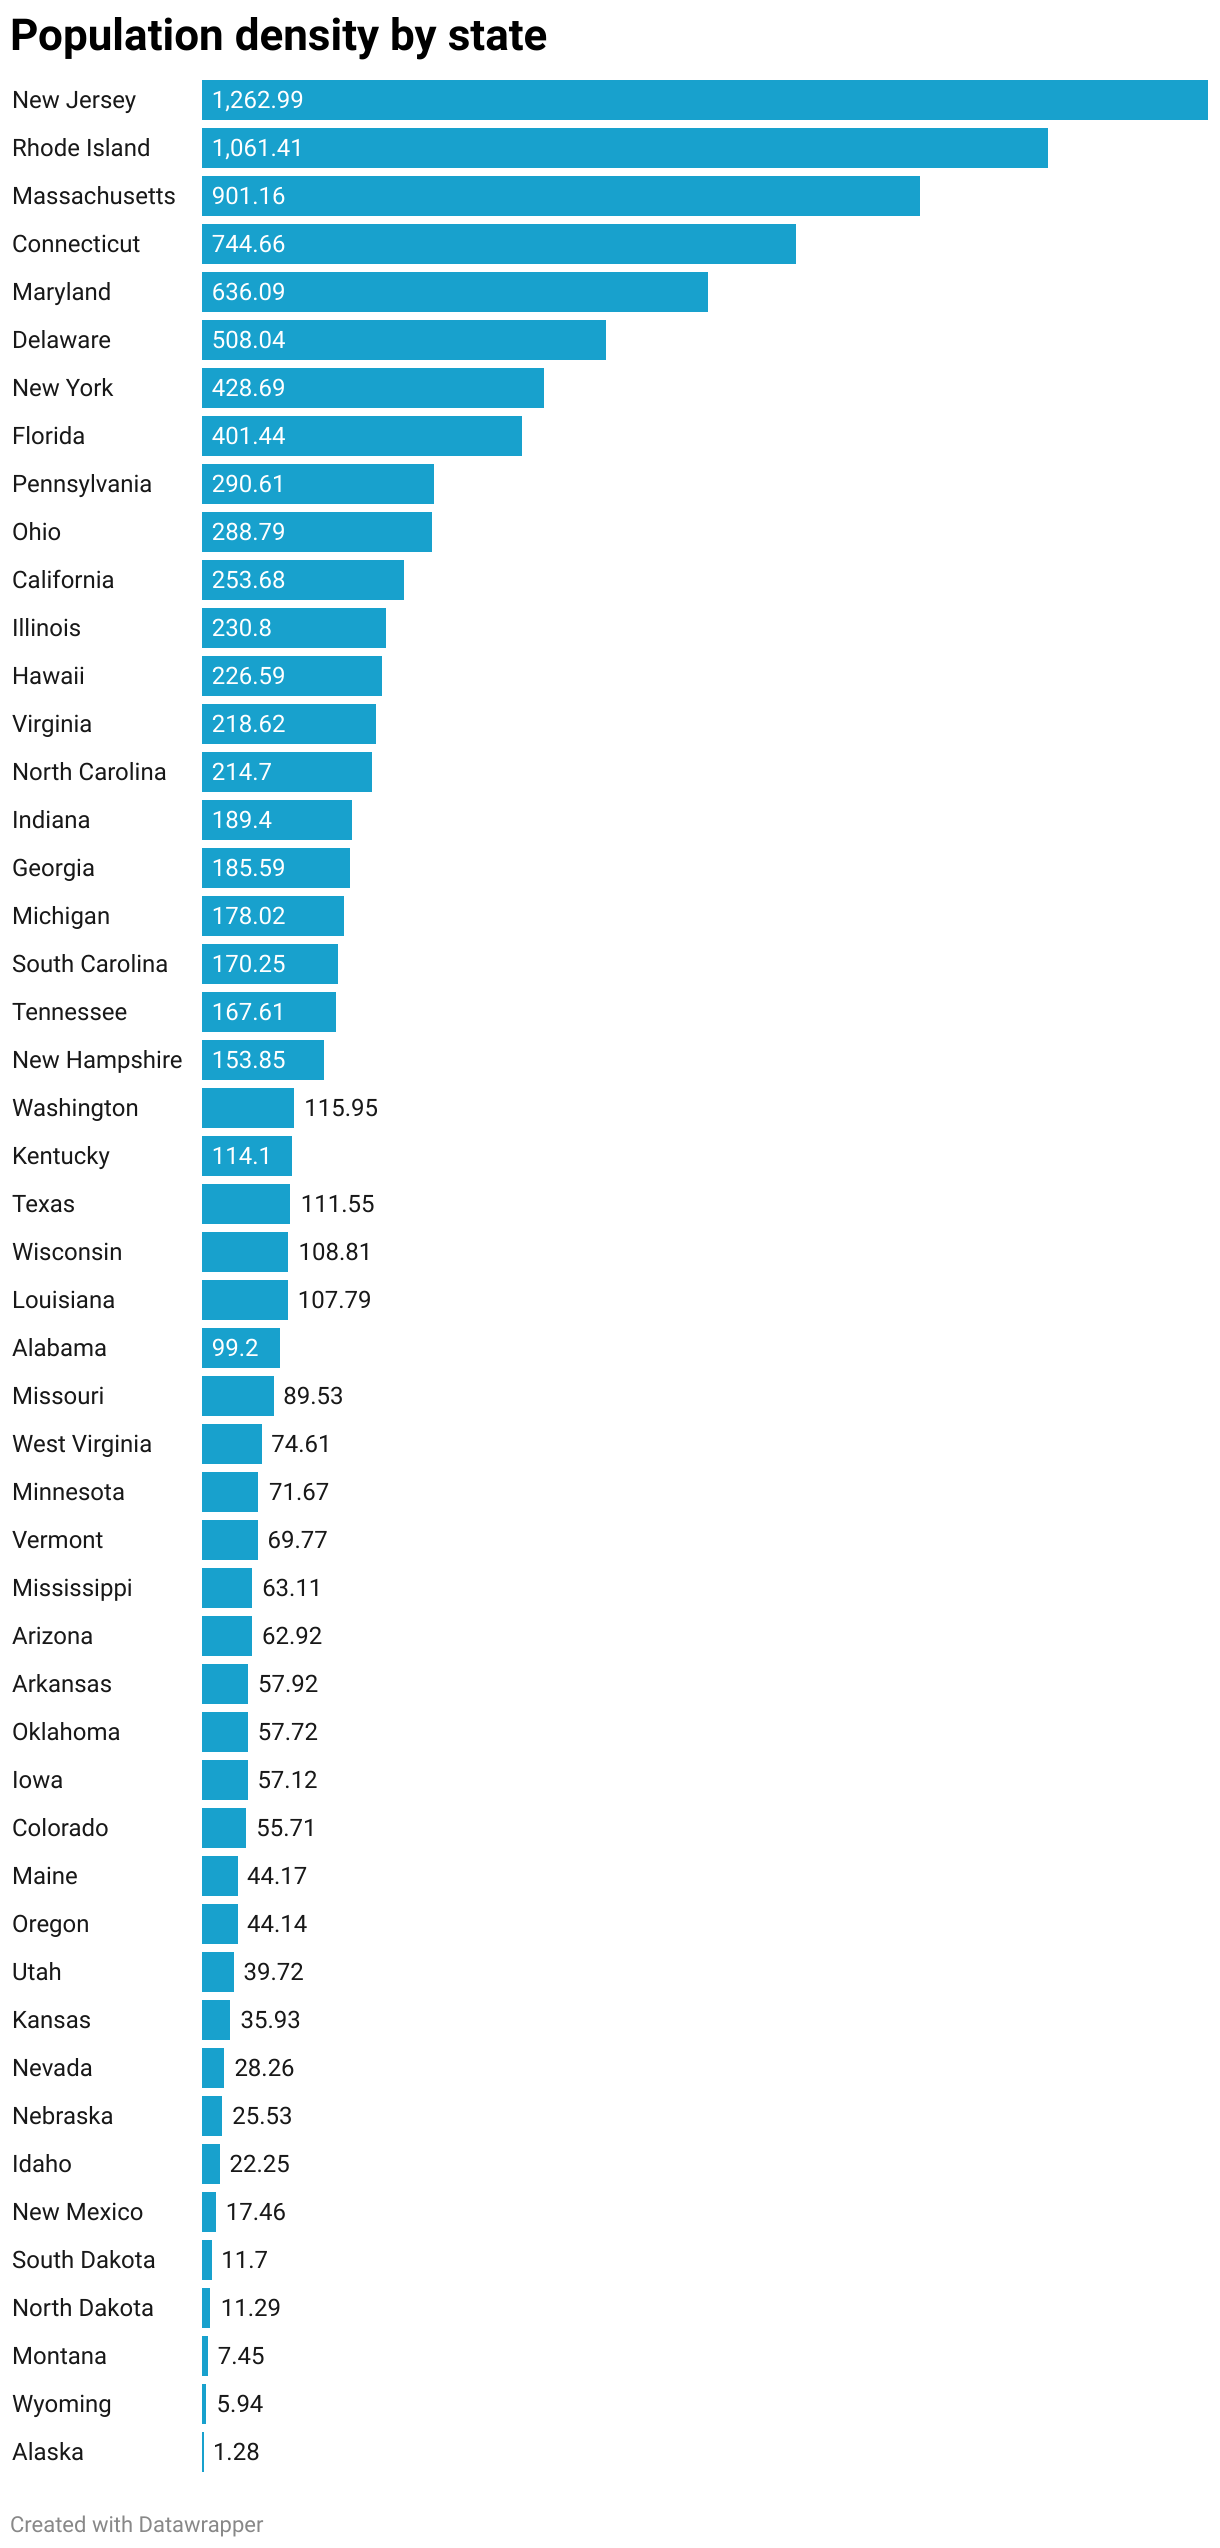
A vertical bar chart