Stat 225 - Continuous review
We have an exam this Thursday. Here are a few problems to help you prepare. Note that includes just about every combination of confidence interval and hypothesis test question using means vs proportions and sample sizes of small vs large. Thus, this is a bit longer than I’d expect the exam itself to be. I guess that lots of practice is a good idea!
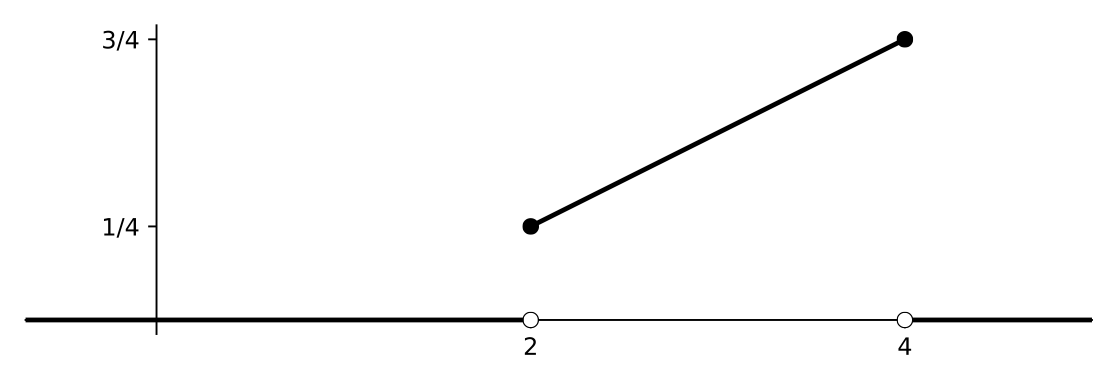
The PDF of a continuous random variable \(X\) is shown in the figure above.
- Explain why the figure represents a good PDF.
- Compute \(P(2<X<3)\).
- Compute \(P(3<X<5)\).
Suppose that the PDF of a continuous random variable on \([0,1]\) is given by \[f(x) = \begin{cases} c x^2 & 0\leq x \leq 1 \\ 0 & \text{otherwise} \end{cases}.\]
- Find the value of \(c\) that makes \(f\) a good PDF.
- Compute \(P(0<X<1/2)\)
- Compute \(E(X)\)
- Compute \(\sigma(X)\)
Suppose that \(X\) is normally distributed with mean \(555\) and standard deviation \(28\). Find \(P(540<X<600)\).
Suppose my classes exam scores are normally distributed with a mean of \(60\) and a standard deviation of \(15\). What percentage of my students score above 90%?
Use a \(u\)-substitution to translate the normal integral \[\frac{1}{\sqrt{20\pi}} \int_0^5 e^{-(x-2)^2/20}dx\] into a standard normal integral.
A sample of 100 North Carolina adults finds their average height to be 67.88 inches with a standard deviation of 4.12 inches
- What is the standard error associated with this sample mean?
- Write down a 95% confidence interval for the height of a North Carolina adult based on this sample.
A sample of 10 North Carolina adults finds their average height to be 66.7 inches with a standard deviation of 4.8 inches
- What is the standard error associated with this sample mean?
- Write down a 95% confidence interval for the height of a North Carolina adult based on this sample.
A sample of 100 North Carolina adults finds that 77 of them exercise some.
- What is the standard error associated with this sample proportion?
- Write down a 95% confidence interval for the height of a North Carolina adult based on this sample.
A sample of 10 North Carolina adults finds that 9 of them exercise some.
- What is the standard error associated with this sample proportion?
- Write down a 95% confidence interval for the height of a North Carolina adult based on this sample.
Suppose we would like to use the data from problem 6 to explore the following question:
Is the average North Carolinian 69.5 inches tall.- Write down the hypothesis test that clearly states the problem.
- Compute the \(p\)-value obtained from this data.
- What is the conclusion of the hypothesis test?
Repeat the previous problem using the data from problem 7.
Suppose we would like to use the data from problem 8 to explore the following question:
Do 3/4 of North Carolinians exercise some.- Write down the hypothesis test that clearly states the problem.
- Compute the \(p\)-value obtained from this data.
- What is the conclusion of the hypothesis test?
Repeat the previous problem using the data from problem 9.