import numpy as np
import pandas as pd
import matplotlib.pyplot as plt
from sklearn.linear_model import LogisticRegressionLogistic regression for NCAA prediction
In this notebook, we’ll learn about one step in the process of assessing the probability that this team beats that team. Specifically, we’ll learn about a topic called logistic regression that’s designed to translate past observations into future probabilities.
We’ll start, of course, with some imports:
Training data
In the context of machine learning, past observations that are organized in a way to teach an algorithm how to classify is often referred to as training data. Our current objective is to teach an algorithm how to predict the likelihood that one team beats another team based on the difference between their Massey ratings. I’ve got some training data for exactly this purpose that lists every Men’s NCAA tournament game since 2010. The data looks like so:
training_data = pd.read_csv('https://www.marksmath.org/data/stat_training_data.csv')
training_data| season | team1_name | team1_massey_rating | team2_name | team2_massey_rating | massey_diff | label | |
|---|---|---|---|---|---|---|---|
| 0 | 2010 | Ark Pine Bluff | -7.423417 | Winthrop | -5.945631 | -1.477785 | 1 |
| 1 | 2010 | Winthrop | -5.945631 | Ark Pine Bluff | -7.423417 | 1.477785 | 0 |
| 2 | 2010 | Baylor | 18.996449 | Sam Houston St | 4.425714 | 14.570735 | 1 |
| 3 | 2010 | Sam Houston St | 4.425714 | Baylor | 18.996449 | -14.570735 | 0 |
| 4 | 2010 | Butler | 13.997684 | UTEP | 14.778773 | -0.781089 | 1 |
| ... | ... | ... | ... | ... | ... | ... | ... |
| 1729 | 2023 | Miami FL | 12.780767 | Connecticut | 21.225009 | -8.444242 | 0 |
| 1730 | 2023 | San Diego St | 16.311344 | FL Atlantic | 13.820686 | 2.490658 | 1 |
| 1731 | 2023 | FL Atlantic | 13.820686 | San Diego St | 16.311344 | -2.490658 | 0 |
| 1732 | 2023 | Connecticut | 21.225009 | San Diego St | 16.311344 | 4.913665 | 1 |
| 1733 | 2023 | San Diego St | 16.311344 | Connecticut | 21.225009 | -4.913665 | 0 |
1734 rows × 7 columns
In each row, we see a team 1 and a team 2, together with their Massey ratings. We also see a massey_diff column, that tells us the the Team1’s Massey rating minus Team2’s. The label column is a Boolean flag indicating if Team1 won the game or not. Note that each game is actually listed twice - once where Team1 wins and once where Team1 loses.
Let’s make a scatter plot of this data. On the horizontal axis, we have the difference between the Massey scores and we have the 0/1 label on the vertical axis. The result looks like so:
plt.figure(figsize=(9,4))
fig = plt.plot(training_data.massey_diff, training_data.label, 'ok', alpha=0.03)
Note that, generally speaking, larger massey_diffs are more likely to have a value of 1 while smaller massey_diffs are more likely to have a value of 0.
Now, the idea behind logistic regression is to fit a particular type of curve to this data. The algebraic form of the curve is something like so: \[f(x) = \frac{1}{1+e^{ax+b}}.\] Here’s an example of such a curve:
plt.figure(figsize=(9,4))
xs = np.linspace(-6,6,100)
ys = [1/(1+np.exp(-x)) for x in xs]
fig = plt.plot(xs,ys)
While this might all seem quite mysterious, the curve does have some nice properties from the point of view of probability:
- It always returns a number between zero and 1 and
- The greater the score difference the more confident we are.
By fit, we mean we try to find values of the parameters \(a\) and \(b\) to minimize the total squared error. Of course, we ask a computer to do this for us! Here’s how:
logreg = LogisticRegression()
X = training_data[['massey_diff']].to_numpy()
Y = training_data.label.to_numpy()
logreg.fit(X,Y)LogisticRegression()In a Jupyter environment, please rerun this cell to show the HTML representation or trust the notebook.
On GitHub, the HTML representation is unable to render, please try loading this page with nbviewer.org.
LogisticRegression()
Now, logreg can be used to make probabilistic predictions. Suppose one team has a Massey rating of 5 and another has a Massey rating of 15. Then, the logreg.predict_proba function can be used to compute the implied probability that team 2 beats team 1 as follows:
logreg.predict_proba([[10]])array([[0.25374749, 0.74625251]])Thus, the probability is 0.746.
We can also see how the prediction curve fits with the data:
xs = np.linspace(-40,40,500)
ys = logreg.predict_proba([[x] for x in xs])
ys = [y[1] for y in ys]

plt.figure(figsize=(9,4))
plt.plot(training_data.massey_diff, training_data.label, 'ok', alpha=0.03)
plt.plot(xs,ys);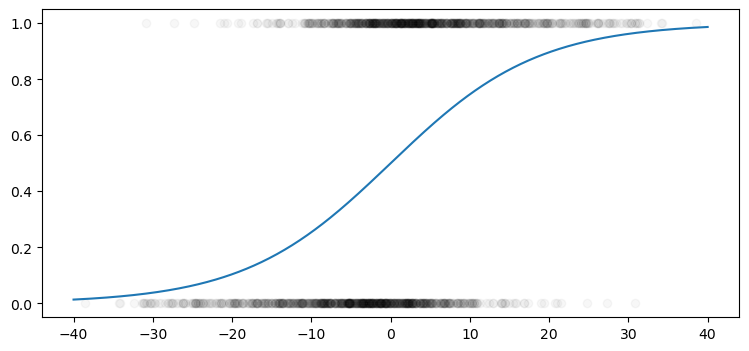
Again, the idea is minimize the total least squared distance between the curve and the points and looks like this curve might do a reasonable job.
Of course, the idea is to apply this tool to the current 2024 season. Here are this years tournament teams, together with their Massey ratings:
seeds = pd.read_csv('https://www.marksmath.org/data/seeds2024.csv')
seeds.index = range(1,len(seeds)+1)
seeds| TeamName | massey_rating | |
|---|---|---|
| 1 | Houston | 26.719731 |
| 2 | Arizona | 25.708375 |
| 3 | Purdue | 25.138448 |
| 4 | Connecticut | 25.080604 |
| 5 | Auburn | 23.691429 |
| ... | ... | ... |
| 64 | Stetson | -4.132888 |
| 65 | Montana St | -4.205119 |
| 66 | Howard | -8.112068 |
| 67 | Grambling | -9.799923 |
| 68 | Wagner | -10.431391 |
68 rows × 2 columns
Note that both of North Carolina’s potential first round opponents, Howard and Wagoner, appear near the bottom. Let’s find UNC, who oughtta be in the top 10 at least:
seeds[:10]| TeamName | massey_rating | |
|---|---|---|
| 1 | Houston | 26.719731 |
| 2 | Arizona | 25.708375 |
| 3 | Purdue | 25.138448 |
| 4 | Connecticut | 25.080604 |
| 5 | Auburn | 23.691429 |
| 6 | Iowa St | 23.380963 |
| 7 | Tennessee | 22.152318 |
| 8 | Alabama | 21.469345 |
| 9 | North Carolina | 21.359366 |
| 10 | BYU | 20.726570 |
So here’s our estimated probability that UNC would beat Howard:
logreg.predict_proba([[21.359366 - (-8.112068)]])array([[0.03995772, 0.96004228]])Thus, the model predicts that UNC has 96% chance of winning that game, which seems a bit low but not totally crazy either.
Final comments
While our prediction for UNC over Howard is not as confident as it should be, don’t forget that this is the first most basic attempt machine prediction in machine learning. There’s a lot more that can be done with logistic regression. Perhaps, the biggest thing is that it can take more variables into account, like
- Other numeric data such as
- Win/loss percentages,
- Offensive/defensive efficiency metrics
- Difference between seed numbers
- Other rating systems
- Categorical data such as conference
If we simply add conference and seed difference as variables, then we would expect our prediction that UNC (a 1 seed in the ACC) should beat Howard (a 16 seed in the MEAC) would improve greatly.
To verify this, the typical work flow breaks the historical data up into training data and testing data so that we gauge how well the algorithm works. SciKit Learn provides an automated pipeline for this purpose. SciKit Learn also provides a workflow for Neural Networks with a consistent command structure.