Midterm Practice Solutions
for Stat 185
Here are the solutions to the practice problems for next week's midterm exam.
Problem 1
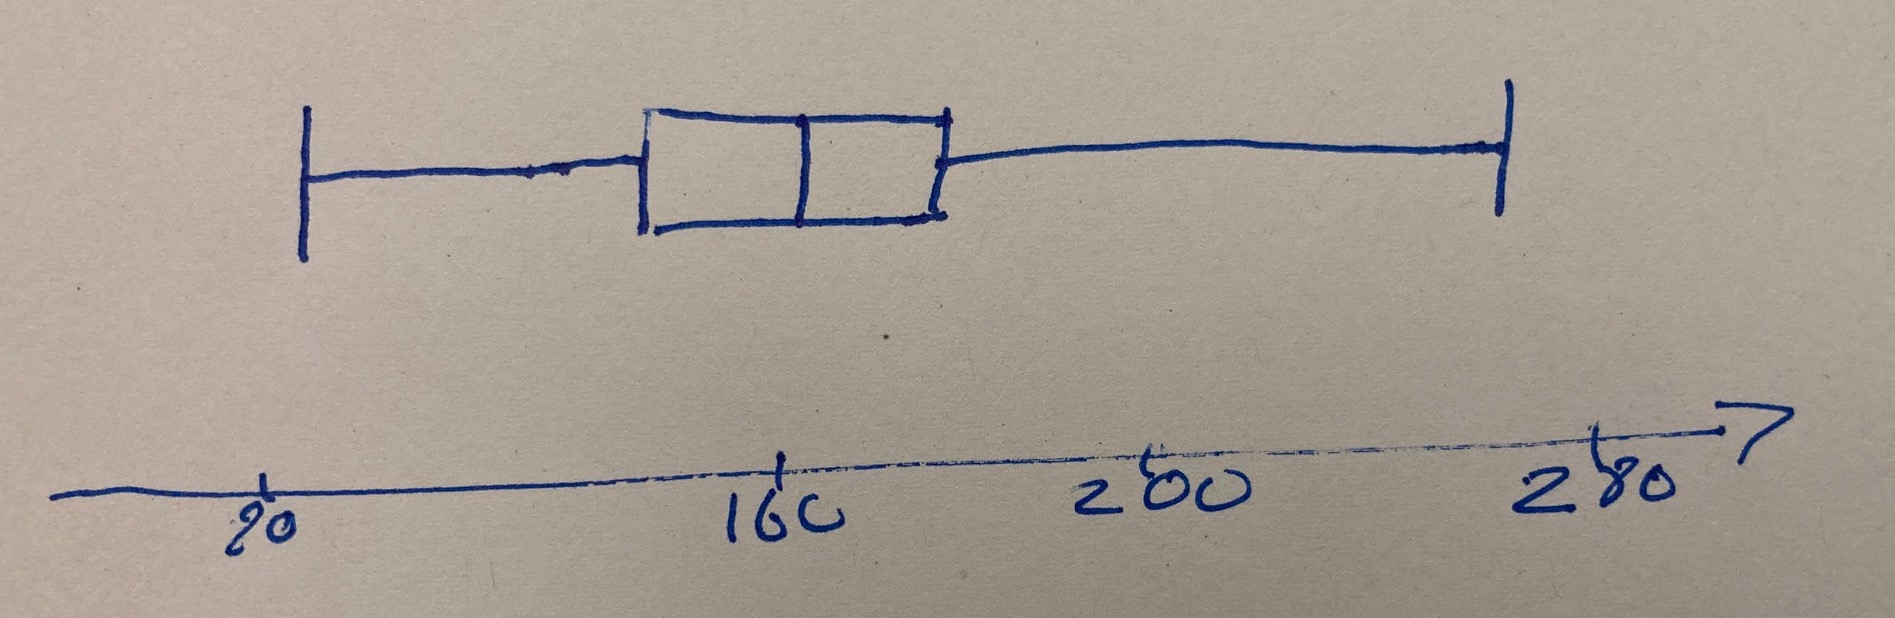
Suppose the five point summary for a data set is| Min | 1st Q | Med | 3rd Q | Max |
|---|---|---|---|---|
| 82 | 141 | 163 | 185 | 276 |
The drawing
Your box-plot ought to look something like so:

Of course, it need not be quite so precise, but some sort of scale is essential.
A little detail
To be clear, the various vertical hash-marks correspond to the following labels:

Hand-drawn
Of course, your version will be hand-drawn.
Problem 2
The CDC recently released the results of its National Health Interview Survey (NHIS). Data in this report come from the combined 2010-2015 NHIS, a large health survey of the U.S. population random sample of U.S. households. The main objective of NHIS is to monitor the health of the U.S. population. The data matrix below shows the first two rows of a simplified version of some of the data.
| gender | age | height | weight | frequency | duration |
|---|---|---|---|---|---|
| F | 40 | 5.58 | 115 | 4 | 30 |
| M | 54 | 5.8 | 160 | 6 | 60 |
- What type of study is this - observational study or controlled experiment?
- Identify the variables in the table and classify them as numerical or categorical.
Solution for part (a)
This is an observational study, since it literally records observations using a survey. It's clearly not an experiment, since there's no control and treatment groups.
Solution for part (b)
The variables are given by the column names. There types (presented in another table) are:
| gender | age | height | weight | frequency | duration |
|---|---|---|---|---|---|
| categorical | numeric | numeric | numeric | numeric | numeric |
| nominal | discrete | continuous | discrete | discrete | discrete |
Problem 3
Compute the mean and standard deviation of the sample $\{9,2,4,5\}$.The mean
The mean $\mu$ of $\{9,2,4,5\}$ is
$$\frac{9+2+4+5}{4} = \frac{20}{4}=5.$$Note that we are simply using the formula
$$\mu=\frac{x_1+x_2+\cdots+x_n}{n}.$$The standard deviation
The sample standard deviation of $\{9,2,4,5\}$ is
$$\sqrt{\frac{(9-5)^2+(2-5)^2+(4-5)^2+(5-5)^2}{3}} = \sqrt{\frac{26}{3}} \approx 2.94392.$$We are now using the formula
$$\sigma = \sqrt{\frac{(x_1-\mu)^2 + (x_2-\mu)^2 + \cdots + (x_n-\mu)^2}{n-1}}.$$Problem 4
The SAT is designed to have a mean of 500 with a standard deviation of 100.- Using the normal distribution rules of thumb, what is the percentile of a score of 700?
- Referring to a normal table, what is the percentile score of a score of 640?
The rules of thumb
By "the normal distribution rules of thumb", we mean the 68-95-99.7 rule as pictured here:
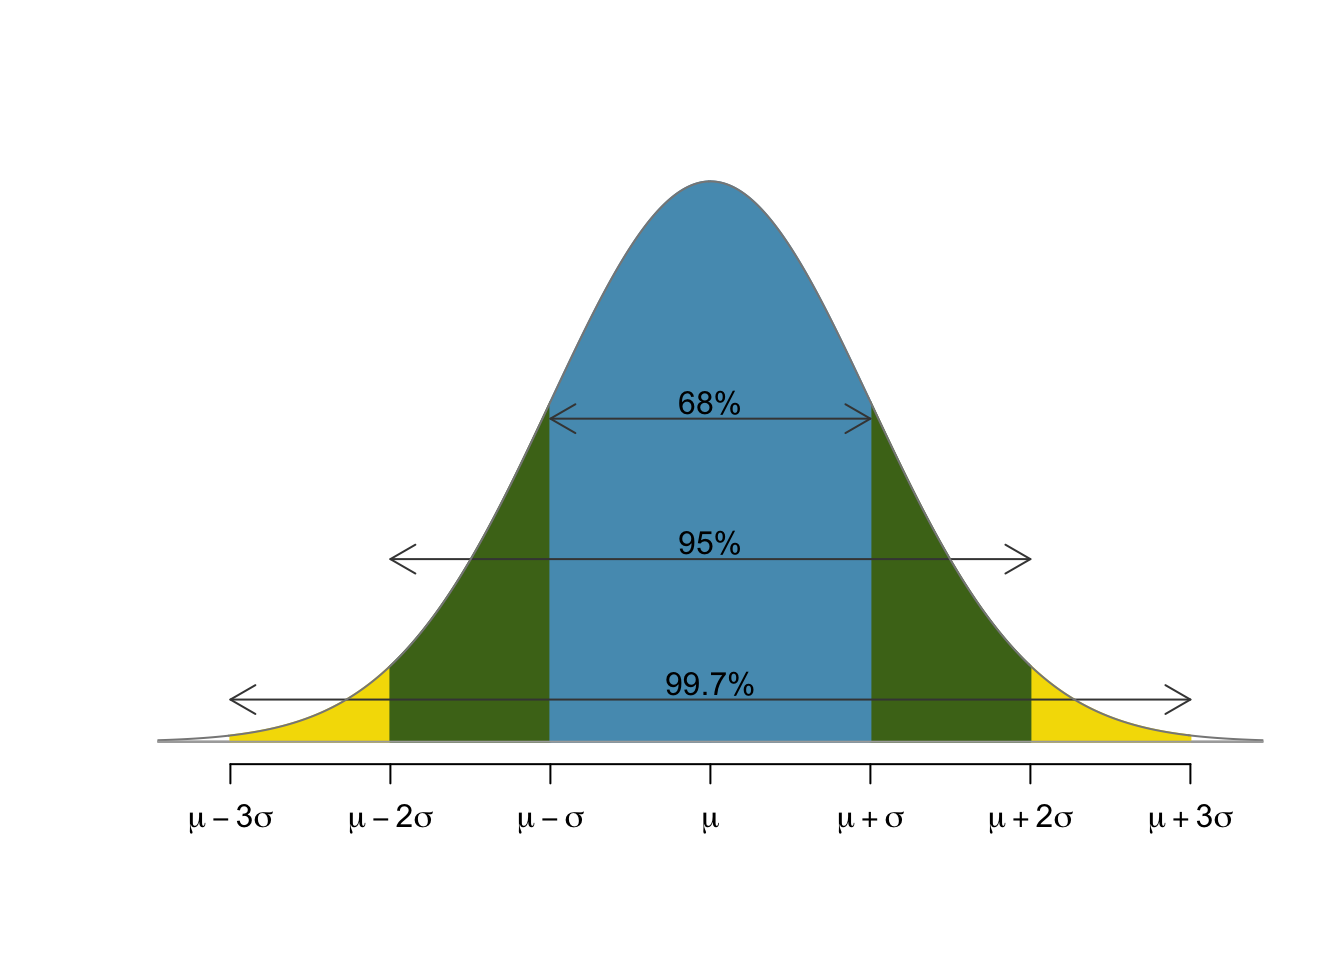
Solution for part (a)
Since $700=500 + 2\times100$, a score of 700 is two standard deviations past the normal. Now our rules of thumb tell us that 95% of the population lies within two standard deviations from the normal. Geometrically, that corresponds to the fact that the shaded area under the standard normal in the figure below is about 0.95. Accounting for the white area to the left of the blue area (which is $0.05/2=0.025$), that yields an area of 0.975 to the left of $Z=2$ for the standard normal. Thus, 700 should be at percentile 97.5.


Solution for part (b)
The $Z$-score for 640 is $$Z = \frac{640-500}{100} = 1.4$$ Looking up 1.4 in this normal table, we see that a score of 640 should put you at percentile 91.92.
Note: You'll be provided the table in the previous link during the exam. It's simply a static version of our interactive table.
Problem 5
Suppose a random sample of 100 people from a population produces an average weight of 165.84 with a standard deviation of 34.44. Use this data to write down a 95% confidence interval for the weights of people in the population.
Solution setup for problem 5
Our solution should look something like $$ [\bar{x}-ME,\bar{x}+ME] = \left[ \bar{x} - z^*\times \frac{\sigma}{\sqrt{n}}, \bar{x} + z^*\times \frac{\sigma}{\sqrt{n}} \right], $$ where
- $\bar{x}=165.84$ is the measured average,
- $z^*=2$ is the $z^*$-multiplier for a 95% level of confidence,
- $\sigma=34.44$ is the standard deviation of the sample, and
- $n=100$ is the sample size.
Solution for problem 5
Taking that all into account, our margin of error is: $$ME = z^* \times SE = 2 \times \frac{34.44}{\sqrt{100}} = 6.888.$$ Thus, our interval is: $$[165.85 - 6.888, 165.85 + 6.888] = [158.962, 172.738].$$
Problem 6
According to FiveThirtyEight, a recent poll of 1005 adults conducted by Ipsos for Reuters found an approval rating of 56% for Joe Biden. Use this data to construct a 95% confidence interval for Biden's approval rating.
Solution setup for problem 6
Our solution should look something like $$ [\hat{p}-ME,\hat{p}+ME] = \left[ \hat{p} - z^*\times \sqrt{\frac{\hat{p}(1-\hat{p})}{n}}, \hat{p} + z^*\times \sqrt{\frac{\hat{p}(1-\hat{p})}{n}} \right], $$ where
- $\hat{p}=0.54$ is the measured proportion,
- $z^*=2$ is the $z^*$-multiplier for a 95% level of confidence,
- $\sigma=\sqrt{p(1-p)}$ is the standard deviation computed from the proportion, and
- $n=100$ is the sample size.
Solution for problem 6
We again use a $z^*$-multiplier of $z^*=2$ but we now have a different formulation of the standard error: $$ME = z^* \times SE = 2 \times \sqrt{\frac{p(1-p)}{n}} = 2\times\sqrt{\frac{0.56\times0.44}{1005}}\approx0.031316.$$ Thus, our interval is $$[0.56-0.031316,0.56+0.031316] = [0.528684, 0.591316].$$
Problem 7
I'd like to construct a poll to determine a confidence interval for Joe Biden's approval rating. If I'd like the margin of error to be $\pm2\%$, how large should my sample size be?
Solution for problem 7
We again use a 95% level of confidence. Thus our margin of error is $$ME = z^* \sqrt{\frac{p(1-p)}{n}} < 2 \sqrt{\frac{1/4}{n}} \stackrel{?}{<}0.02.$$ Solving that last inequality for $n$, we find $$n>\frac{1}{4} \left(\frac{2}{0.02}\right)^2 = 2500.$$